
Core Ultra X7 358H vs Ryzen AI 9 HX 470: Is the $100 Upgrade Worth It?
💡 Quick answer: for gaming and general use, start with the Intel F2A at USD 1,199. Consider the AMD F2A at USD 1,299 when Cinebench-style CPU rendering or a supported Ryzen AI workflow is the deciding need. Neither fixed 32GB configuration fits workloads that need more memory.
The right choice between the Core Ultra X7 358H and Ryzen AI 9 HX 470 depends on your games and applications. This guide compares their specifications and benchmarks, then explains whether the AMD option in the ACEMAGIC F2A is worth another USD 100.
US reference prices on October 30, 2026 are USD 1,199 for Intel and USD 1,299 for AMD. Both F2A configurations include 32GB of memory and a 1TB SSD.

Quick Verdict: Which Processor Fits Your Work?
Match the processor to the work you actually do.
- For CPU rendering, AMD has the stronger published Cinebench averages. Intel leads the Geekbench 6.x multi-core group, so the CPU winner depends on the workload.
- For integrated-graphics gaming, broader Arc B390 testing favors Intel. For local AI, start with the model, software backend, and memory requirements.
- In the F2A, Intel also costs USD 100 less and adds a Gen5 SSD slot. AMD makes sense when its rendering results or a supported Ryzen AI workflow meet a specific need.
Core Ultra X7 358H vs Ryzen AI 9 HX 470: Processor Specifications
The CPU, graphics, and AI hardware all differ.
The 358H combines Panther Lake CPU cores with Intel Arc B390 graphics. The HX 470 combines Zen 5 and Zen 5c cores with Radeon 890M. Both include an NPU, a dedicated processor for supported AI workloads.
| Specification | Core Ultra X7 358H | Ryzen AI 9 HX 470 |
|---|---|---|
| Processor | Core Ultra X7 358H | Ryzen AI 9 HX 470 |
| Platform codename | Panther Lake | Gorgon Point (Ryzen AI 400 series platform) |
| CPU architecture | Cougar Cove P cores; Darkmont E / LP-E cores | Zen 5 and Zen 5c |
| CPU cores/threads | 16 / 16 | 12 / 24 |
| Core layout | 4 P + 8 E + 4 LP-E | 4 Zen 5 + 8 Zen 5c |
| CPU core manufacturing process | Intel 18A | TSMC 4nm |
| P-core / Zen 5 base clock | 1.9GHz | 2.0GHz |
| Maximum CPU boost | Up to 4.8GHz | Up to 5.2GHz |
| L3 / Smart Cache | 18MB Intel Smart Cache | 24MB L3 |
| Processor base/default power | 25W processor base power | 28W default TDP |
| Other processor power ratings | 15W minimum assured; 80W max turbo | 15–54W configurable TDP |
| Integrated graphics | Intel Arc B390 | AMD Radeon 890M |
| GPU architecture | Xe3 | RDNA 3.5 |
| GPU execution units | 12 Xe cores | 16 compute units |
| Maximum GPU frequency | Up to 2.5GHz | Up to 3.1GHz |
| NPU performance | Up to 50 TOPS | Up to 55 TOPS |
| Processor LPDDR5X support | Up to 9600 MT/s | Up to 8533 MT/s |
| Processor PCIe support | PCIe 5.0 and 4.0 | PCIe 4.0 |
Sources: intel.com; amd.com. Core architecture details also appear in the Notebookcheck references below.
Processor-level memory and PCIe support can differ from what a PC implements. Intel's power ratings and AMD's thermal design power (TDP) range also use different definitions; neither is a whole-system power measurement.
Xe cores and Radeon compute units are not directly comparable. Core counts, boost clocks, and process names cannot establish a performance ranking across these architectures.
CPU Benchmarks: Single-Core and Multi-Core Performance
CPU benchmarks show different workload strengths.
All scores are points; higher is better. Compare the processors within each row.
💡 Benchmark note: These are aggregated Notebookcheck and PassMark database results, not controlled head-to-head tests of the ACEMAGIC F2A. Actual F2A scores can differ with cooling, power limits and LPDDR5X memory speed.
| Benchmark | Core Ultra X7 358H | Ryzen AI 9 HX 470 | Difference |
|---|---|---|---|
| Cinebench R23 single-core average | 2,061 | 2,063 | Effectively even |
| Cinebench R23 multi-core average | 18,086 | 23,030 | AMD +27.3% |
| Cinebench 2024 single-core average | 123 | 120 | Intel +2.5% |
| Cinebench 2024 multi-core average | 1,015 | 1,163 | AMD +14.6% |
| Geekbench 6.x single-core grouped average | 2,865 | 2,939 | AMD +2.6% |
| Geekbench 6.x multi-core grouped average | 16,398 | 14,763 | Intel +11.1% |
| PassMark Single Thread Rating | 4,107 | 4,103 | Effectively even |
| PassMark CPU Mark | 33,714 | 36,969 | AMD +9.7% |
Sources: notebookcheck.net; cpubenchmark.net. The HX 470 Notebookcheck database page is listed in References.
- Notebookcheck reports averages across tested systems. Its Geekbench group includes multiple 6.x revisions.
- PassMark is a synthetic benchmark database. These figures aggregate submitted PerformanceTest results from the September 4, 2026 page snapshot.
- Percentage leads use (higher score / lower score - 1) × 100, rounded to one decimal place. Single-core gaps below 0.1% are labeled effectively even.
- Compare each row separately. Different scoring scales cannot be combined into an overall score.
What the CPU results mean for your work
Single-core results are close: Cinebench R23 and PassMark are effectively level, while Cinebench 2024 and Geekbench lean in opposite directions. A small average lead is unlikely to settle a browsing or office-work purchase.
AMD's Cinebench multi-core results give it the stronger CPU rendering case. Geekbench 6.x multi-core favors Intel, however. For compiling, compression, or another specific job, prioritize an application-level test rather than assuming the rendering lead carries across.
Video editing and media acceleration
Intel lists Quick Sync Video and hardware AV1 encoding and decoding for the 358H. Adobe documents Quick Sync support for H.264/H.265 in Premiere. HandBrake's QSV documentation for AV1 encoding on supported hardware is listed in References.
For DaVinci Resolve, consult the supported-codec matrix for your operating system and free or Studio edition. Codec profile, bit depth, and export settings determine which acceleration is available.
GPU effects processing and codec acceleration are separate. An accelerated effect does not prove Quick Sync is handling the media. Adobe's Mercury Playback Engine guide is listed in References.
Intel Arc B390 vs Radeon 890M: Gaming Performance
Arc B390 has the stronger graphics case here.
Notebookcheck's review of the 358H-powered M2 Pro found Arc B390 ahead of Radeon 890M in most GPU benchmarks. This supports an Intel-first gaming recommendation, but the tested computer was not an F2A.
Arc B390 vs Radeon 890M in mini PC gaming
Reference examples only—not a controlled head-to-head comparison. Different games, settings and review sources mean these FPS figures cannot establish which F2A is faster. They are not decisive evidence for choosing between the two.
The Intel recommendation follows broader Arc B390 testing, not a comparison of the two figures below.
| Review sample | Game and reported settings | Average frame rate |
|---|---|---|
| Intel F2A, Retro Handhelds | Rise of the Tomb Raider; 1080p High, 4x SSAA, triple-buffered VSync, tessellation and screen-space reflections enabled | 40.13 FPS |
| AMD F2A, Neowin | Cyberpunk 2077; 1080p High, ray tracing off, FSR 2.1 Quality | 35.84 FPS |
Sources: retrohandhelds.gg; neowin.net. These are independent examples with different settings. The Radeon 890M gaming result uses FSR 2.1 Quality, not native rendering or FSR 4.1.
Intel supports LPDDR5X-9600 at the processor level; the F2A lists LPDDR5X-7500. Faster-memory systems can therefore give an overly optimistic impression of this configuration. Look for your games at the resolution and settings you intend to use.
Competitive play and emulation
For competitive games, prioritize consistent frame times and responsiveness. Check results without generated frames. For emulation, use evidence from the emulator and rendering backend you plan to run; CPU demand and graphics compatibility can outweigh a general GPU ranking.
Native rendering, upscaling and frame generation
Native rendering provides a baseline. Upscaling reconstructs an image from a lower internal resolution; frame generation adds intermediate frames. Keep those results separate when comparing performance.
Check the game's XeSS or FSR implementation and hardware requirements. Our FSR 4.1 compatibility and DLSS comparison guide explains the AMD requirements; a result recorded with FSR 2.1 does not demonstrate FSR 4.1 performance.
Judge image quality in motion around foliage, fine lines and characters. A higher displayed FPS number alone does not establish better responsiveness.
Power, Cooling and Noise: What the Tests Show
Power settings affect performance and fan behavior.
Intel's processor base/turbo ratings and AMD's TDP range do not establish which complete PC consumes less power. Efficiency needs measured power under a defined workload.
Notebookcheck's Arc B390 analysis shows performance changing with package power limits; that page is listed in References. Cooling and the selected performance mode help explain differences between systems using the same processor.
Neowin measured around 10W at Windows idle and a maximum of roughly 34–35W during PCMark 10 on its AMD F2A sample. These are whole-system readings for those tasks, not gaming power figures.
The reviewer described the fan as unobtrusive, but there is no matched acoustic comparison here. If quiet sustained operation matters, prioritize measured dB(A) levels for the exact configuration, workload, and performance mode. Check microphone distance and background noise when comparing reviews.
Local AI: NPU TOPS, Model Size and Real Performance
Check model memory before comparing AI throughput.
NPU TOPS and software support
The 358H's NPU is rated at up to 50 TOPS; the HX 470's at up to 55 TOPS. NPU TOPS cannot predict text-generation speed.
ACEMAGIC also advertises combined platform figures of up to 180 TOPS for Intel and 86 TOPS for AMD, including CPU, GPU, and NPU. These are marketing aggregates, not a unified compute pool that a local LLM runtime can automatically use.
OpenVINO GenAI supports specific model preparation and execution paths on the NPU. Ryzen AI's large language model (LLM) software documentation is listed in References. Identify the model, application, and backend before comparing CPU, GPU, or NPU results. A chatbot application does not automatically use the NPU.
Ryzen AI 9 HX 470 local LLM performance on a 64GB test system
ACEMAGIC supplied these HX 470 results and confirmed 64GB of RAM in the test system. They are not measurements of the 32GB F2A configuration.
| DeepSeek-R1-Distill model | Quantization label | Reported memory usage | Generation speed |
|---|---|---|---|
| Qwen-7B | Q2 | 3.8G | 22.33 tokens/s |
| Qwen-7B | Q8 | 8.1G | 10.4 tokens/s |
| Qwen-14B | Q4 | 9.7G | 8.89 tokens/s |
| Qwen-14B | Q8 | 15.6G | 5.47 tokens/s |
| Qwen-32B | Q4 | 31.5G | 2.19 tokens/s |
Source: ACEMAGIC-provided HX 470 test data, 64GB system RAM. Memory figures retain the supplied units.
Software, execution backend, context length, and detailed quantization format were not supplied. These results do not establish NPU performance. We also do not have a matched 358H OpenVINO NPU result for these exact models and quantization formats, so the table cannot rank the two CPUs for local LLM use.
The supplied 7B Q2 result uses less memory and runs faster than 7B Q8. The 32B Q4 workload is slower and occupies much more memory. Answer quality was not measured, so test the chosen quantization on your own tasks.
What the F2A's 32GB capacity means
Windows, applications, and model working memory share the installed RAM. The reported 31.5G for the 32B Q4 workload leaves no comfortable allowance in a 32GB system; this evidence does not support recommending that workload for the retail configuration.
💡 The retail F2A's 32GB shared memory is not a general-purpose 70B workstation. Match model size, quantization, and backend before paying the AMD premium for local LLM work.
Ollama's default Llama 3.3 70B package is about 43GB, exceeding the installed capacity before other memory needs. Other quantizations and execution methods differ, but this is not a general-purpose 70B workstation.
If local LLM use is your priority, seek community or independent results for the exact model and quantization. Match the Ollama or OpenVINO backend, memory capacity, and context length before paying the AMD premium. A supported Ryzen AI development workflow can justify the choice; an unverified generation-speed advantage cannot.
ACEMAGIC F2A 358H vs 470: What Changes in the PC?
The F2A adds a USD 100 price gap and fixed memory.
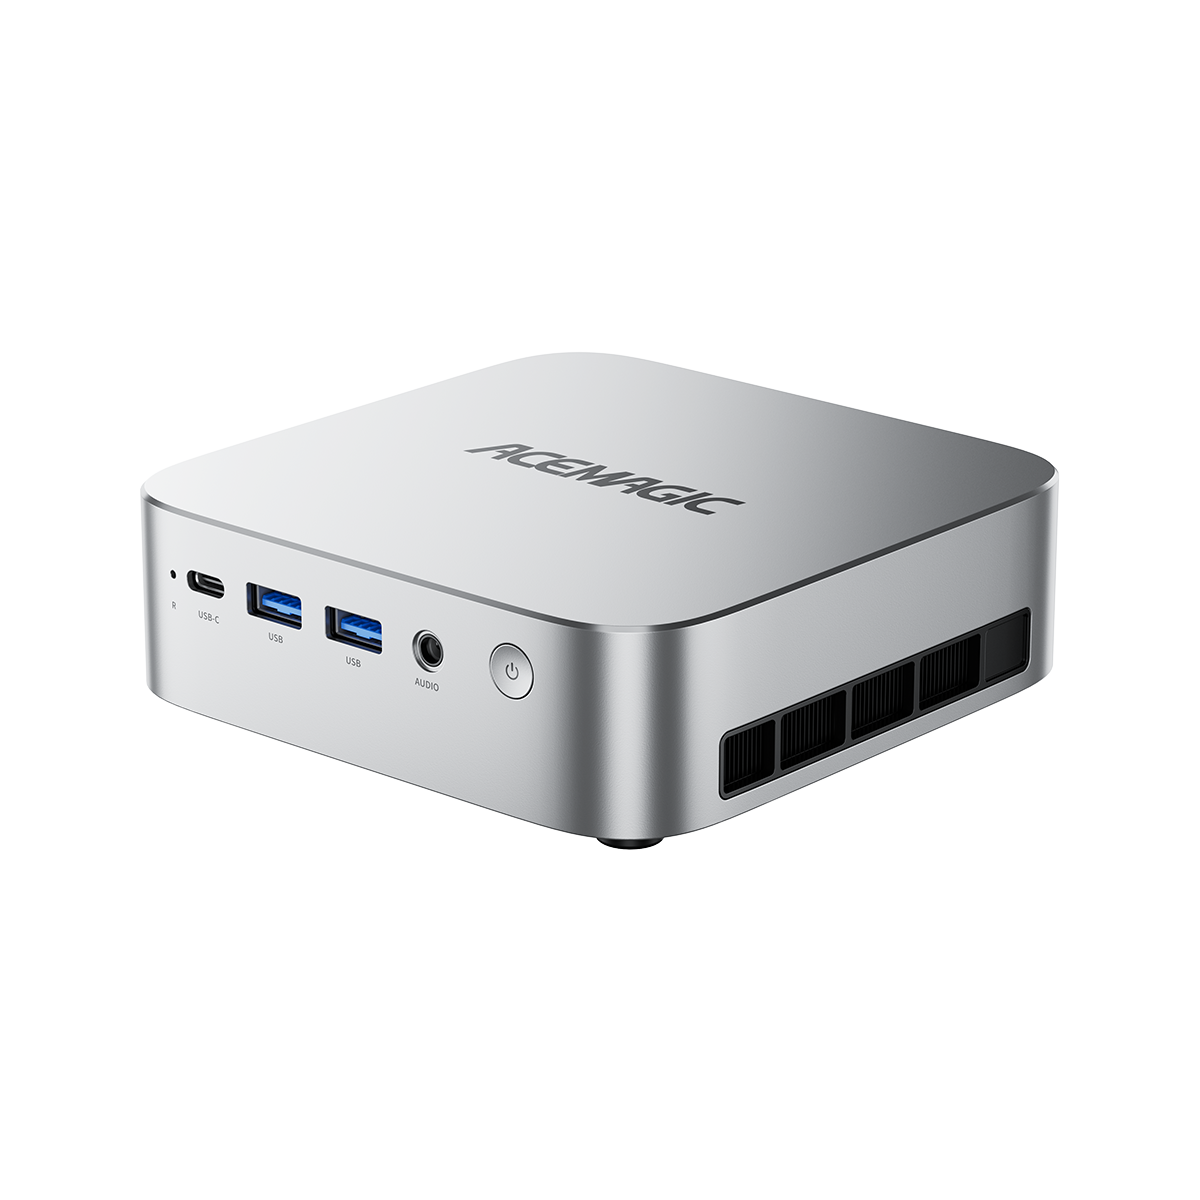
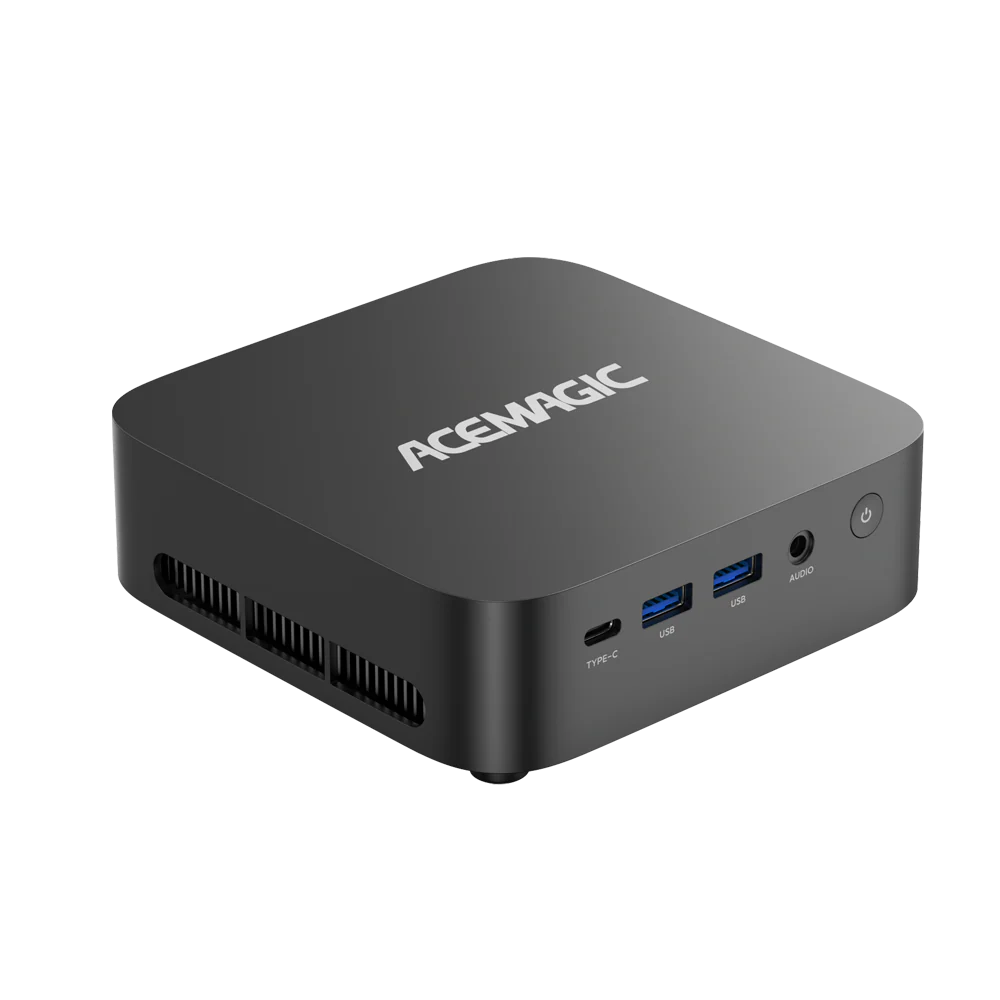
The 2026 F2A offers both processors in the same desktop design. This table covers the actual configurations, rather than processor-level capabilities. They are different products from the older 125H and 155H F2A models.
| Buying detail | Intel F2A | AMD F2A |
|---|---|---|
| Reference US price | USD 1,199 | USD 1,299 |
| Installed memory | 32GB LPDDR5X-7500 | 32GB LPDDR5X-7467 |
| Included SSD | 1TB | 1TB |
| RAM upgrades | Onboard memory; no upgrade slots | Onboard memory; no upgrade slots |
| M.2 interfaces | One PCIe 4.0 x4, one PCIe 5.0 x4 | Two PCIe 4.0 x4 |
| HDMI output listed | HDMI 2.1 TMDS, up to 4K60 | HDMI 2.1 TMDS, up to 4K60 |
| USB4 | One 40Gbps port | One 40Gbps port |
| Additional USB-C | Separate USB-C port | Separate USB-C port |
Source: ACEMAGIC F2A configuration specifications. Pricing is subject to change; confirm the selected option's drive and display support.
Intel's Gen5 x4 slot is a concrete expansion advantage between these configurations. Its benefit depends on the SSD and workload. For a 4K120 television, the listed HDMI output does not meet that target; another connection needs its own compatibility check.
For one actual CPU result, Neowin's AMD F2A sample scored 14,535 in Geekbench 6 multi-core. Keep that separate from the processor-wide averages above. The full review is linked in the gaming table source note and References.
For an external GPU, budget for a compatible USB4 enclosure and card. Our OCuLink vs USB4 guide explains the routes; F2A's published port list does not include native OCuLink.
Which ACEMAGIC F2A Should You Buy?
Spend the extra USD 100 on a benefit you can name.
When choosing at purchase, AMD is worth considering for CPU rendering or a supported Ryzen AI workflow. Intel remains the lower-cost gaming option and adds Gen5 SSD expansion.
| Your main use | Recommended starting point | What should decide it |
|---|---|---|
| Integrated-graphics gaming plus office work | Intel F2A, USD 1,199 | Arc B390 evidence, results for your games and lower price |
| Editing with a supported Intel media workflow | Intel F2A, USD 1,199 | Your editor, footage and hardware-acceleration support |
| Need a PCIe 5.0 NVMe SSD slot | Intel F2A, USD 1,199 | One Gen5 x4 M.2 slot; AMD lists two Gen4 x4 slots |
| CPU rendering or an application with a measured AMD advantage | AMD F2A, USD 1,299 | Cinebench rendering lead; other CPU tests show different strengths |
| AI development using a supported Ryzen AI path | AMD F2A, USD 1,299 | Exact model, backend and driver support within 32GB |
| General office use without a platform requirement | Intel F2A, USD 1,199 | Lower cost when AMD adds no needed capability |

AI alone is not a reason to pay more: Intel also has an NPU software path. If your workload needs more than 32GB, resolve that capacity requirement first. Our mini PC buying guide covers broader setup choices.
Frequently Asked Questions
Confirm the exact hardware before adding software.
Why isn't the NPU showing up after Windows setup?
Check Device Manager and the correct driver package. Retro Handhelds had to install NPU drivers on its Intel review sample; that does not establish the state of every shipment. Start with ACEMAGIC's driver downloads and processor-vendor guidance. Ask support if the matching package is unclear.
Can I use drivers from the older F2A on the new model?
Match packages to the actual CPU and platform. The F2A name spans generations, so an older Intel driver is not automatically suitable for a 358H or AMD model. Never select a BIOS image solely because its filename includes F2A.
Will a cloud AI service run faster on the AMD F2A?
For a cloud-hosted model, the service's servers handle inference. Choose the PC for the work you run locally, and check any on-device AI features separately. Microsoft's local and cloud AI guidance explains the distinction.
Can I upgrade RAM on the F2A?
No. Both 2026 F2A configurations compared here ship with 32GB of soldered onboard memory and have no RAM slots. Choose a different memory configuration or system at purchase if your workload needs more than 32GB.
What should I check before installing a second SSD?
Confirm M.2 2280 dimensions, NVMe protocol, PCIe interface, clearance, and thermal requirements. Follow the instructions for your model. Neowin found access to its AMD sample difficult, so obtain guidance before opening the case if instructions are missing.
Final Verdict: Core Ultra X7 358H or Ryzen AI 9 HX 470?
Gaming favors Intel; CPU results depend on the test.
AMD leads the published Cinebench rendering results and CPU Mark; Intel leads Geekbench 6.x multi-core. Single-core performance is close. The USD 1,199 Intel F2A is our starting choice for gaming and general use, while the USD 1,299 AMD F2A deserves consideration when rendering or a supported Ryzen AI workflow matters most.
| Priority | Practical conclusion |
|---|---|
| Integrated-graphics gaming | Start with Intel F2A; the evidence comes from broader GPU testing |
| CPU rendering | Consider AMD F2A; published Cinebench averages favor HX 470 |
| Gen5 NVMe expansion | Intel F2A provides a PCIe 5.0 x4 M.2 slot |
| Local LLM generation speed | No matched winner established; compare the actual model and backend |
| More than 32GB of memory | Neither fixed-memory F2A configuration meets that need |
Select the CPU and 32GB + 1TB option on the F2A page above, and confirm the current price and delivery details. On the AMD OpenClaw listing, check the software option too: preinstalled OpenClaw does not include an AI model.
References and Data Sources
- Intel. “Intel Core Ultra X7 Processor 358H Specifications.” intel.com.
- AMD. “AMD Ryzen AI 9 HX 470.” amd.com. “Ryzen AI LLM software overview.” ryzenai.docs.amd.com.
- Notebookcheck. “Intel Core Ultra X7 358H Processor Benchmarks and Specs.” notebookcheck.net. “AMD Ryzen AI 9 HX 470 Processor Benchmarks and Specs.” notebookcheck.net. “Minisforum M2 Pro mini PC review.” notebookcheck.net. “Intel Panther Lake Arc B390 performance and efficiency analysis.” notebookcheck.net.
- PassMark Software. “Intel Core Ultra X7 358H vs AMD Ryzen AI 9 HX 470.” cpubenchmark.net.
- Adobe. “Optimize playback performance for H.264/H.265 media.” helpx.adobe.com. “Mercury Playback Engine GPU Accelerated.” helpx.adobe.com.
- HandBrake. “Video QSV.” handbrake.fr.
- Blackmagic Design. “DaVinci Resolve 21 Supported Codec List.” blackmagicdesign.com.
- Retro Handhelds. “ACEMAGIC Focux F2A Review.” retrohandhelds.gg.
- Neowin. “ACEMAGIC F2A HX 470 Review.” neowin.net.
- OpenVINO. “Inference with GenAI on NPU.” docs.openvino.ai.
- Ollama. “Llama 3.3 tags.” ollama.com.
- Microsoft. “Windows local and cloud AI.” learn.microsoft.com.